Heap corruption crash dump collection
A heap corruption is defined as a problem that violates the heap’s integrity and produces unexpected behavior in an application. It can happen if dynamic memory allocation and deallocation aren’t handled appropriately in application code.
Some of the common causes of heap corruption -
- Buffer overrun (writing beyond the allocated memory) overrun and underrun
- Double free (freeing a pointer twice)
- Old pointer reuse(reusing a pointer after being freed)
- Dangling Pointers
The process would not crash until the corrupted heap is accessed, but when a thread tries to use that corrupted block of memory in the heap, the application process will terminate, which makes it difficult to troubleshoot. If we capture a normal crash dump in this scenario, the problematic thread we’ll see in the dump, may not be the one that triggered the problem, but rather could be the victim thread.
So, to find the underlying cause and determine the actual issue, we should capture crash dump with pageheap enabled.
To know more about Heap, please refer below articles -
Following are the steps to capture heap corruption crash dumps using Debug Diag tool –
- Launch Debug Diag tool (Start -> Programs -> DebugDiag 2 Collection)
- If the Debug diag is already running, Start the Rules Wizard by activating the Rules tab and clicking the
Add Rulebutton on the bottom of the tabbed dialog. If this is the first time you have run DebugDiag.Collection.exe then the rules wizard will start automatically. -
Select the
Crashoption in the Select Rule Type Dialog and clickNext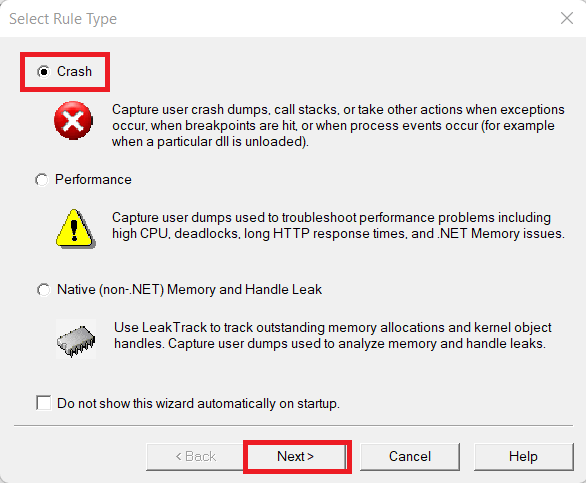
- In the Select Target Type Dialog choose
A specific processand clickNext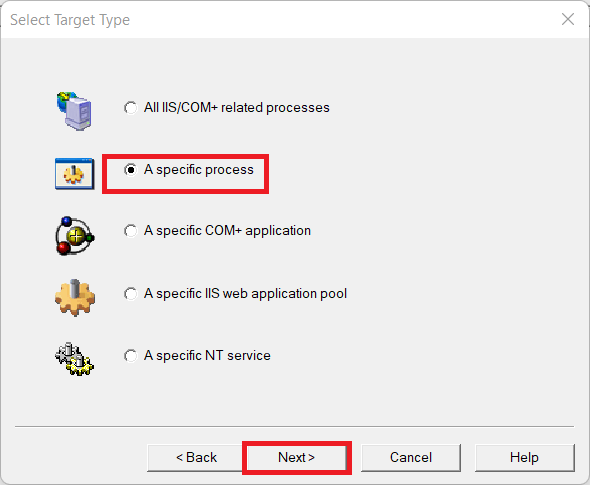
Alternatively, we could also select
A specific IIS Web application pooland then affectedApplication Pool.
-
Select the
w3wp.exeprocess from the list of processes and clickNext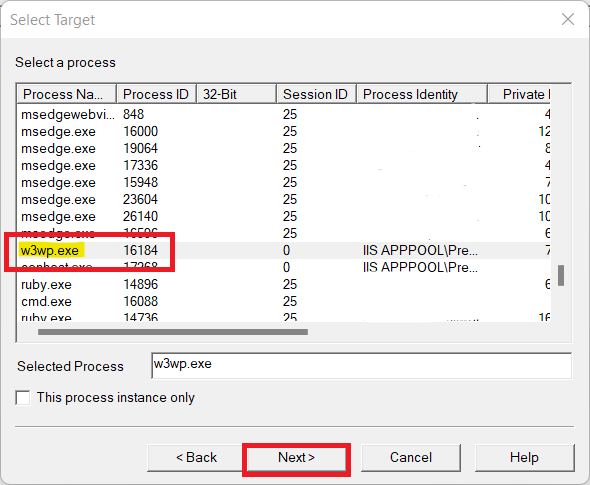
-
In the Advanced Configuration dialog box click the
PageHeap Flags...button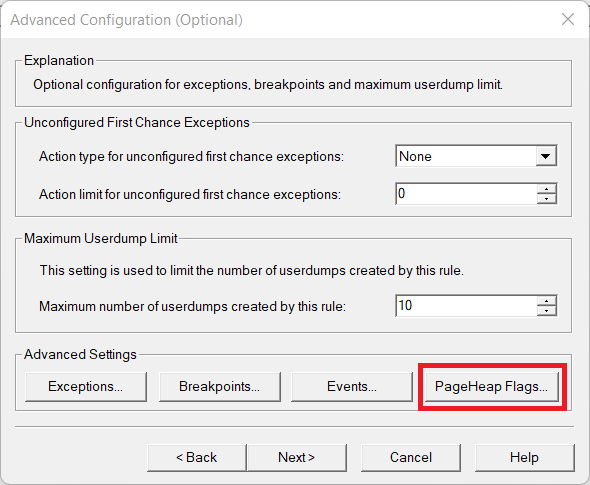
-
In the PageHeap Flags dialog choose the
Enable Full PageHeapoption and clickOKand thenYESfor the warning prompt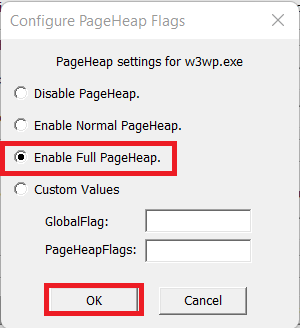
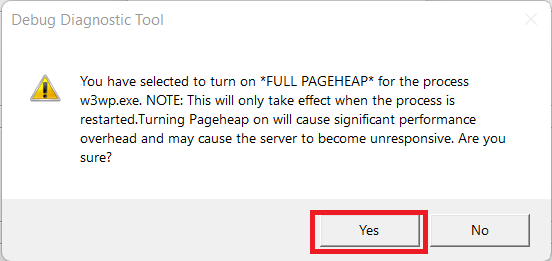
-
In the Advanced Configuration dialog click
Next.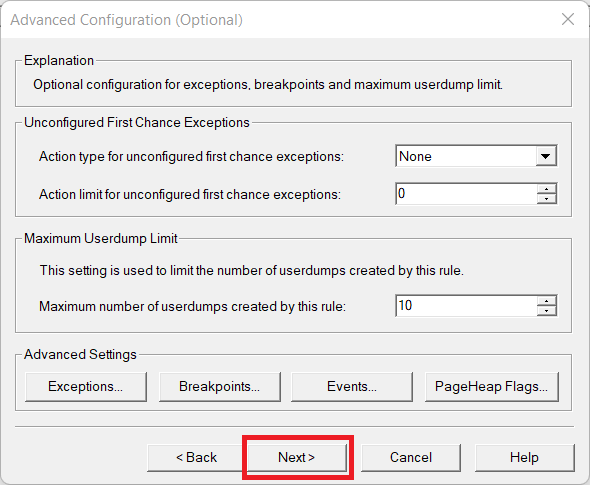
-
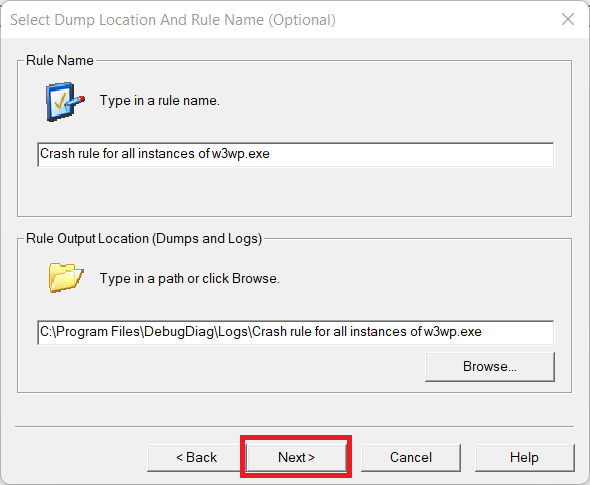
In the
Select Dump Location and Rule Namedialog, specify a name for this crash rule, and specify a directory where the dump files will be created (you may leave the defaults as well) and clickNext.
-
In the Rule Completed dialog choose
Activate the rule nowand clickFinishbutton.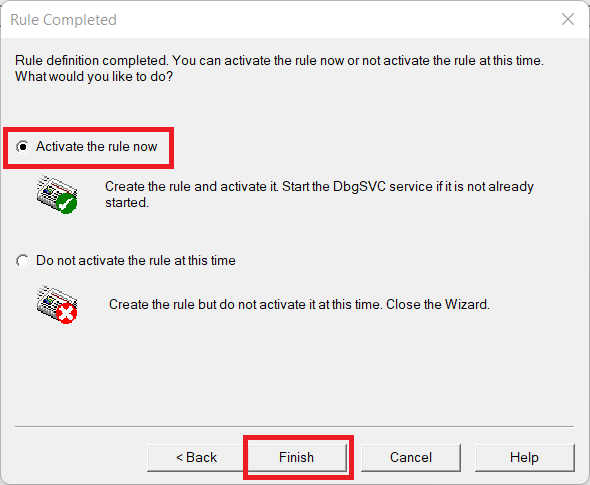
-
Once you click on
Finishbutton on previous dialog, it will take you to the final screen where you will see the newly created rule details and make sure status should beActive.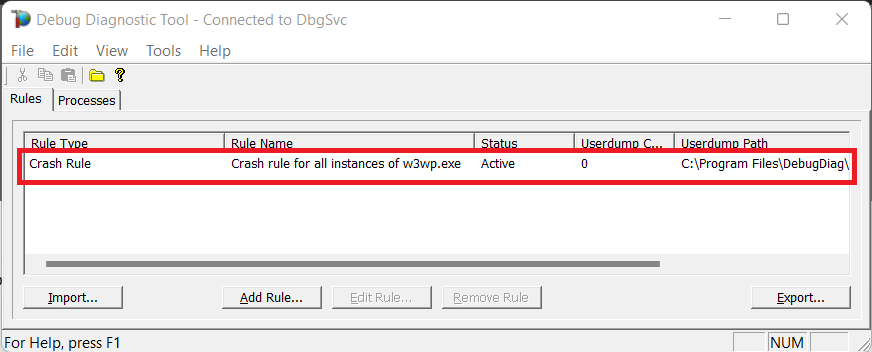
-
At this point in time, w3wp.exe will need to be restarted to enable PageHeap for the process. Once w3wp.exe is restarted, you are done. You will need to wait for the next occurrence to have the dumps generated. The rule is now active and DebugDiag has attached DbgHost.exe to the w3wp.exe process and is debugging the process live. If heap corruption occurs, a full userdump will be generated.
Note: Since pageheap is enabled per process, every instance of w3wp.exe running on the system will have pageheap. There is also a performance impact associated with pageheap that would cause the processing to slow down a bit due to heap verification.
If pageheap dump is not much helpful and you want to retrieve more detailed info about the heap corruption to understand the root cause of the issue and make the code fix easier, you can use Application Verifier in combination with Debug Diagnosis to capture the dumps.
Other alternative data capturing Options:
Capturing Dumps using Debug diag and Application Verifier. .
Application Verifier can be downloaded from here
OR
Capture Heap corruption crash dumps using GFlag - Steps to capture Heap corruption crash dumps using GFlag. GFlag can be downloaded from here.
Hope it helps! :-)

Comments